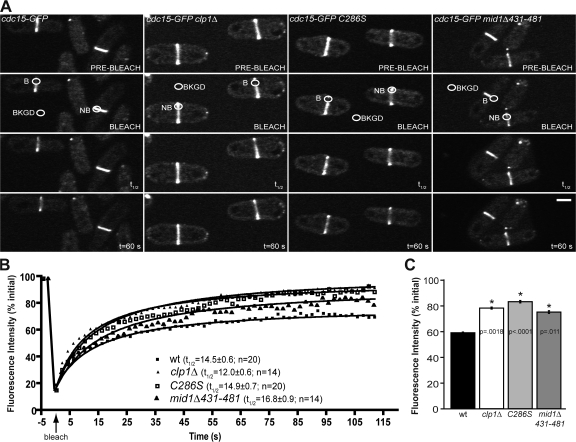
Figure 3.
Clp1 regulates Cdc15 dynamics at the CR. (A) Representative images from confocal FRAP measurements of Cdc15-GFP at the CR in wild type, clp1Δ, clp1-C286S, and mid1Δ431-481 cells. B, bleach region; NB, nonbleached region (used to correct for overall bleaching); BKGD, background region (used to correct for overall bleaching). Bar, 5 μm. (B) Fluorescence recovery curves including half-times with standard error and number of cells analyzed per strain. Best-fit curves derived from the mean intensity values of n cells (Prism software) were used to calculate half-times and mobile fractions. R2 values: wt, 0.9877; clp1Δ, 0.9802; clp1-C286S, 0.9819; and mid1Δ431-481, 0.9762. (C) Mobile fraction graphs from confocal FRAP measurements of Cdc15-GFP. Asterisks indicate significant differences between wild-type and experimental cells as determined by student's t test. P-values and standard error are included.

