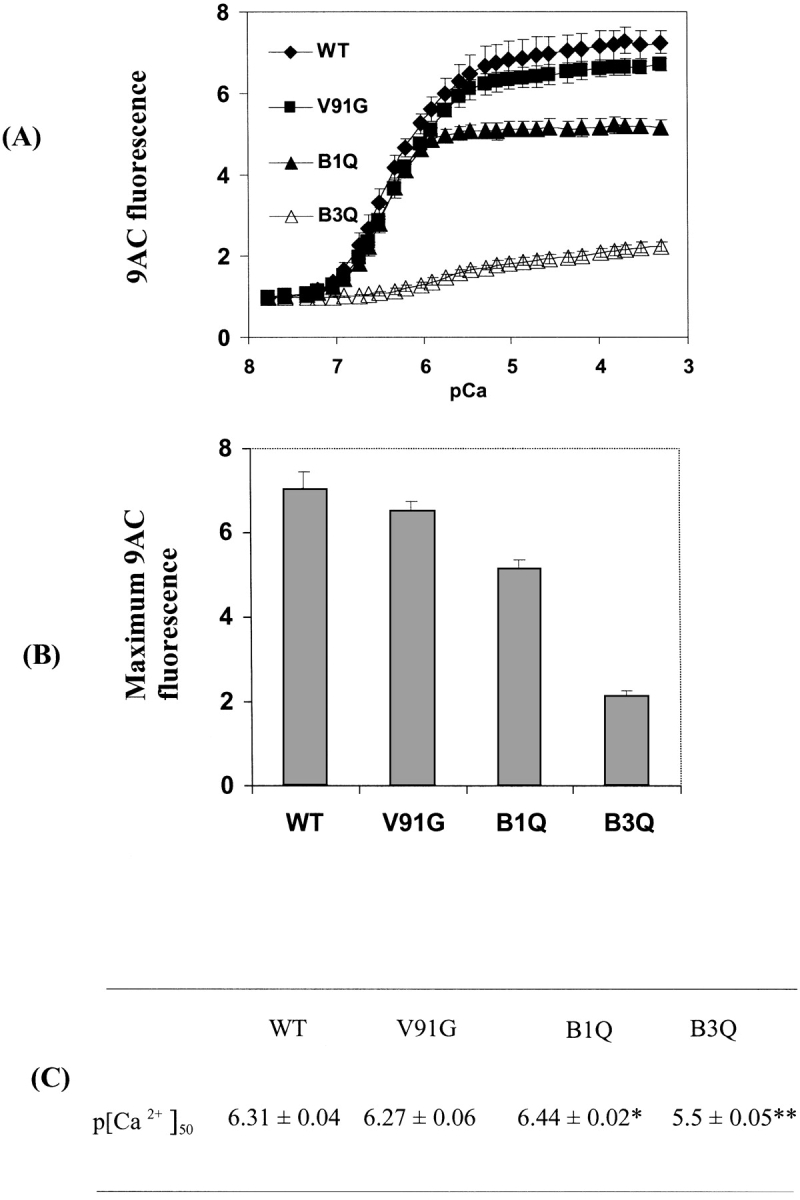
Figure 4.

9AC fluorescence enhancement during calcium titration of WT and mutant D-CaMs. (A) Fluorescence enhancement curves. 9AC fluorescence enhancement during calcium titration is shown for WT D-CaM, V91G D-CaM, and for mutants with no calcium binding at site 3 (B3Q) or site 1 (B1Q). (B,C). Maximum fluorescence enhancement (Max) (B) and p[Ca2+]50 (C) for all CaMs studied. Max and p[Ca2+]50 were calculated by fitting the data to sigmoidal dose-response curves with variable slopes using Prism software (see Materials and Methods). Data for WT and V91G are from five repetitions; for B3Q and B1Q, from three repetitions. Error bars = std. dev. Significance of differences from WT CaM are as follows: *, P < 0.01, **, P < 0.0001.
