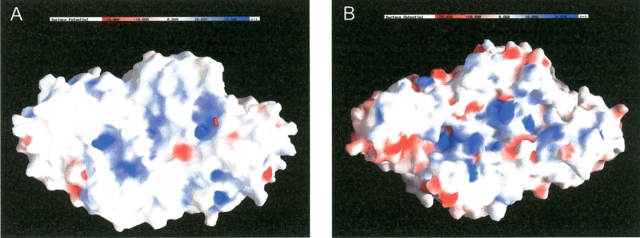
Figure 7.
Surface charge comparison of NAD+-dependent G3PDH from L. mexicana (A) and NADP+ dependent G3PDH from A. fulgidus (B). The surface potential maps were calculated in the presence of 100 mM salt. This figure was prepared with GRASP (Nicholls et al. 1993).

