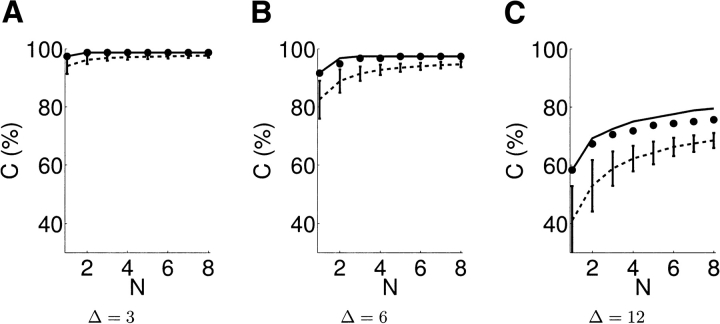
Figure 9.
Relative performance of different approaches to planning lysine-specific experiments for FGF-2 model discrimination. Shown are a “planning-free” expectation over 1000 random plans (mean is shown as dashed line with standard deviation error bars), a randomized planning approach (separate circles) considering the best from the set of random plans, and finally XlinkPlan (solid line).

