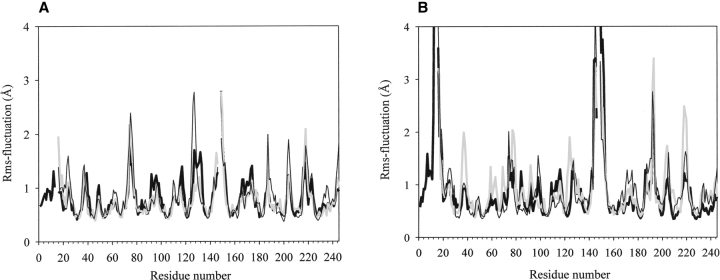
Figure 4.
Rms fluctuations (Kruger and Szameit 1992) plotted vs. the amino acid sequence number (WT chymotrypsin numbering; see Materials and Methods and Fig. 1 ▶), calculated for the MD simulations on the inactive structures (A) and for the TMD activation paths (B) of bWT (black bold line), bΔA-chymotrypsin (gray bold line), and rΔA-chymotrypsin (black line).

