Figure 3.
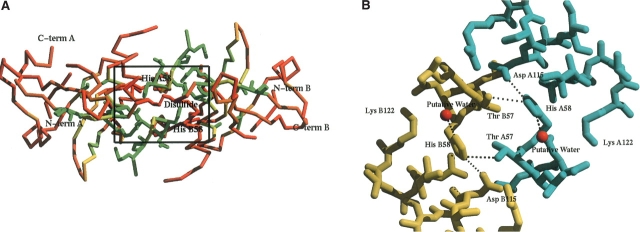
Putative active site region for TM0160. (A) Regions of residue conservation as determined by the sequence alignment in Figure 1B ▶. Residues are colored from red representing 0% conservation to green at 100%. Those residues that are 100% conserved are also displayed as a ball-and-stick representation. Conservation is calculated as the percent of conserved residues among the 17 sequences displayed in Figure 1B ▶. The figure was generated with Bobscript (Kraulis 1991; Esnouf 1997) and Raster3d (Meritt and Murphy 1994). (B) Close-up of putative active site region of TM0160 as defined in A. Molecule A is colored cyan, while molecule B is colored yellow. The putative water molecules coordinated to His 58 are colored red. Interactions <4.0 Å are represented as dashed black lines. The picture was generated by Bobscript (Kraulis 1991; Esnouf 1997) and Raster3d (Meritt and Murphy 1994).

