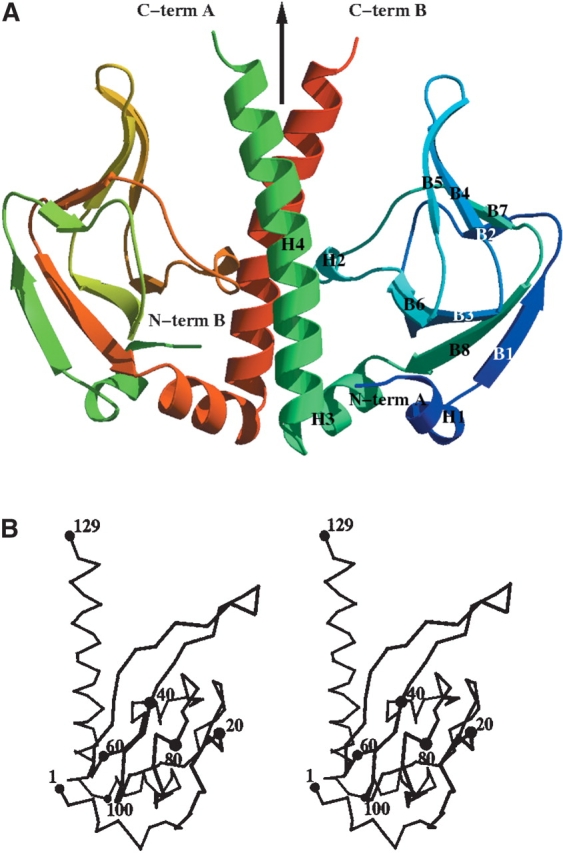
Figure 4.

Overall structure of TM1171. (A) Ribbon representation of the dimer of TM1171 cNTP domain. Molecule A is colored from blue to green from the N terminus to the C terminus, while molecule B is represented from green to red over the same range. The dimer was produced by rotating one subunit around a crystallographic twofold axis, which is represented by an arrow. (B) Stereo trace of TM1171 dimer. Residues are labeled every 20 residues. The figures were generated with VMD (Humphrey et al. 1996).
