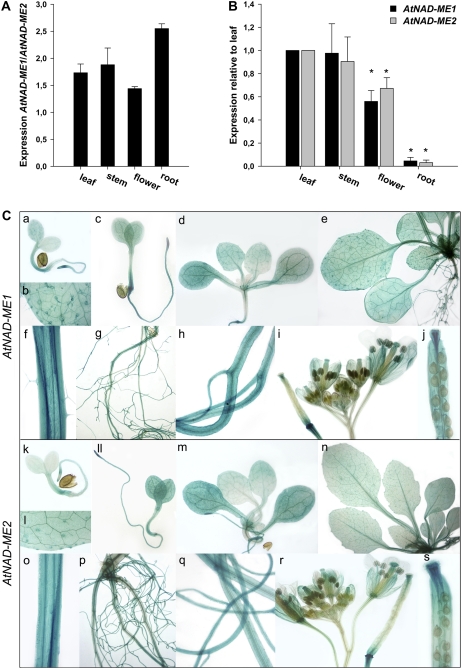
Figure 2.
Expression analysis of AtNAD-ME in different tissues. A, Expression of AtNAD-ME1 transcript relative to AtNAD-ME2 mRNA levels for each organ analyzed by qRT-PCR. B, Relative expression of AtNAD-ME1 and AtNAD-ME2 in different organs with respect to leaf analyzed by qRT-PCR. The y axis refers to the fold-difference of a particular AtNAD-ME transcript level relative to its amount found in leaf. The asterisks indicate that the expression values obtained were statistically significantly different from the ones obtained for leaf as determined by the Student's t test (P < 0.05). C, Analysis of AtNAD-ME∷GUS expression. a to j, AtNAD-ME1∷GUS; k to s, AtNAD-ME2∷GUS. a to d and k to m, Seedlings at 3, 5, and 12 DAI. e and n, Three-week-old rosette. f and o, Longitudinal section through the stem. g and p, Root system of a 3-week-old plant. h and q, Close-ups of the roots. i and r, Inflorescence with flowers at different stages. j and s, Siliques.

