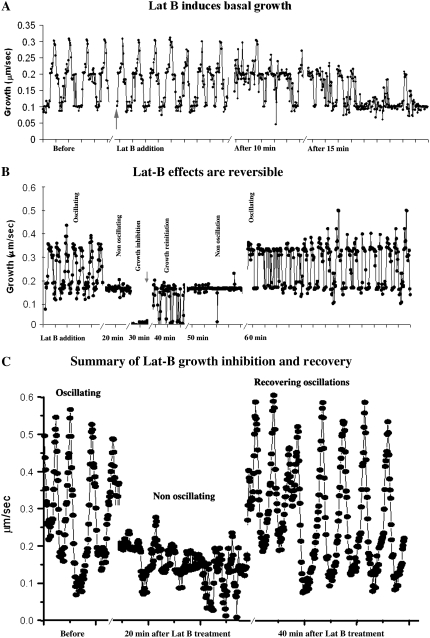
Figure 1.
Graphs showing the changes in pollen tube growth rate in response to application of Lat-B (2 nm). These data, which are representative of 10 different cells, show individual pollen tubes that have been cultured in microscope chambers in which the medium composition has been controlled by a flow-through pump. Figure 1A shows details on the initial effects of Lat-B on the growth rate. No effect is observed during the first 5 min. After 10 min the growth rate starts to decline, and by 20 min approaches a basal, nonoscillating condition. Figure 1B shows growth inhibition and recovery in response to Lat-B addition and removal. After 30 min in Lat-B, growth is fully inhibited. Nevertheless, when Lat-B is removed, full recovery of oscillatory growth occurs over the next 30 to 40 min. Figure 1C provides a summary of normal growth, nonoscillating growth and full recovery.

