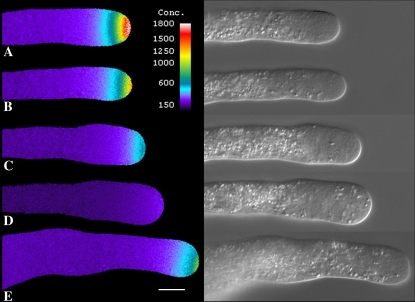
Figure 3.
Visualization of intracellular Ca2+ following Lat-B treatment. A pollen tube loaded with fura-2-dextran shows a clear Ca2+ gradient (A). However, addition of Lat (2 nm) decreased the Ca2+ gradient slightly after 5 min (B), which became much more evident by 10 min (C). After 20 min the Ca2+ gradient has almost disappeared, and growth has stopped (D). Removal of Lat-B allowed recovery of growth and the tip-focused Ca2+ gradient, which became evident within 15 min (E). Scale bar is 10 μm.

