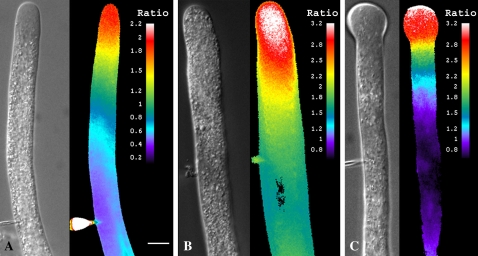
Figure 6.
Effect of Lat-B on G-actin. Figure 6A shows a pollen tube that has been microinjected with DNase as a G-actin probe and tetramethyl-rhodamine-dextran as a reference marker for ratiometric measurements. The images indicate a pool of G-actin in the apical region of the tube. A corresponding DIC image reveals the morphology of the pollen tube. Figure 6B shows a pollen tube after 20 min in Lat-B. Note the increased fluorescent signal in the apex, and the complete disappearance of the clear zone in the DIC image. Figure 6C shows a pollen tube after 25 min in Lat-B. The fluorescent signal remains high in the swollen apex, but especially so toward the tip of the dome. Scale bar is 10 μm.

