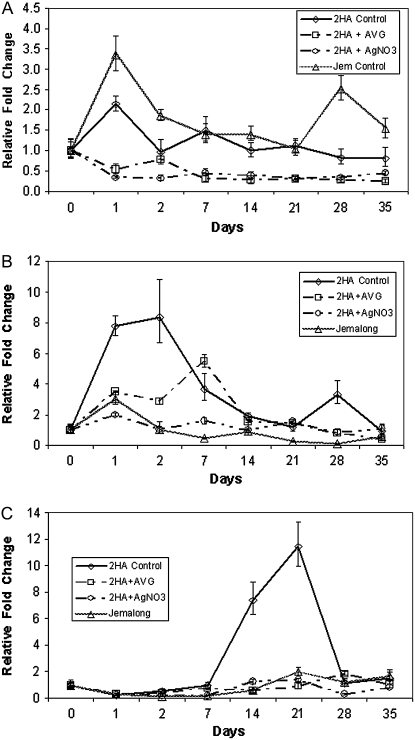
Figure 4.
Relative expression of ACS (TC95406; A), ACO (TC106655; B), and MtSERF1 (TC102138; C) during the development of embryogenic cultures from leaf explants of 2HA or nonembryogenic Jemalong using qRT-PCR. The 2HA cultures were also treated with the ethylene biosynthesis inhibitor AVG at 10 μm or the ethylene perception inhibitor Ag+ at 10 μm. All data for each time point are derived from the same cDNA. The fold change is normalized to the starting leaf tissue. sem indicated.

