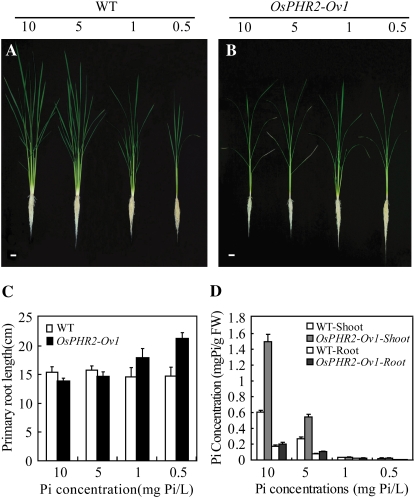
Figure 5.
Growth performances of wild type (WT) and the OsPHR2-Ov1 line at different Pi levels in a solution culture. A and B, Growth of 30-d-old seedlings of wild type and OsPHR2-Ov1 in hydroponic solutions with 10, 5, 1, and 0.5 μg mL−1 Pi. Scale bars in A and B represent 2.5 cm. C, Primary root length of wild type and OsPHR2-Ov1 at different Pi levels. Error bars indicate se (n = 8). D, Pi concentrations in shoots and roots of wild-type and OsPHR2-Ov1 plants. Error bars indicate se (n = 5). [See online article for color version of this figure.]

