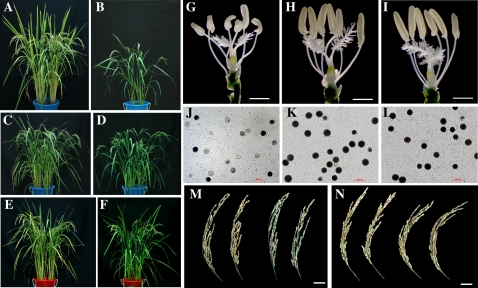
Figure 6.
Growth performances of wild type and the OsPHR2-Ov1 line at different Pi levels in a pot experiment. A and B, Growth performances of wild type (A) and OsPHR2-Ov1 (B) at HP level (200 mg Pi/kg soil). C and D, Growth performances of wild type (C) and OsPHR2-Ov1 (D) at moderate Pi level (120 mg Pi/kg soil). E and F, Growth performances of wild type (E) and OsPHR2-Ov1 (F) at LP level (60 mg Pi/kg soil). G to I, Anther structure of OsPHR2-Ov1 (G) and wild type (H) at HP level (200 mg Pi/kg soil), and OsPHR2-Ov1 under LP level (I; 60 mg Pi/kg soil). J to L, Pollen viability of OsPHR2-Ov1 (J) and wild type (K) at HP level (200 mg Pi/kg soil), and OsPHR2-Ov1 under LP level (L; 60 mg Pi/kg soil). The scale bars represent 1 mm for anthers, 50 μm for pollens. M, Panicle filling rate of wild type (left) and OsPHR2-Ov1 (right) at HP level (200 mg Pi/kg soil). N, Panicle filling rate of wild type (left) and OsPHR2-Ov1 (right) at LP level (60 mg Pi/kg soil).

