Figure 3.
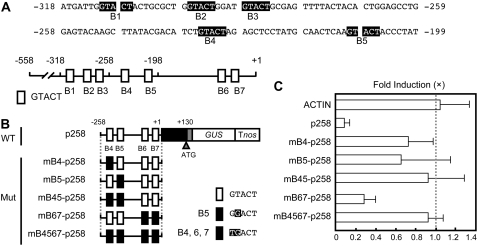
The GTACT motif is required for Cu responsiveness. A, Sequences of the region (−318 to −199) that are involved in Cu responsiveness. The GTACT sequences are printed in white on black. The bottom diagram represents the location of GTACT sequences. GTACTs are shown as boxes (B1–B7) and numbered from the 5′ end of the FeSOD promoter. B, Mutagenesis of GTACT motifs. The mutated GTACT sequences are indicated by black boxes in the schematic diagram of constructs. The mutated bases in B4 to B7 are highlighted. Wild type (WT) containing −258 to +130 was used as a positive control. C, Effect of mutations in GTACT motifs on Cu responsiveness. The bars represent the GUS activities of transgenic moss plants cultured in the presence of 2.0 μm CuSO4. The GUS activities of the transgenic plants cultured in the absence of CuSO4 were arbitrarily set to 1.0 (dotted line). The actin promoter-GUS (ACTIN) was used as a control. For each construct, at least three independent transgenic plants were examined. The bars indicate ± sd.

