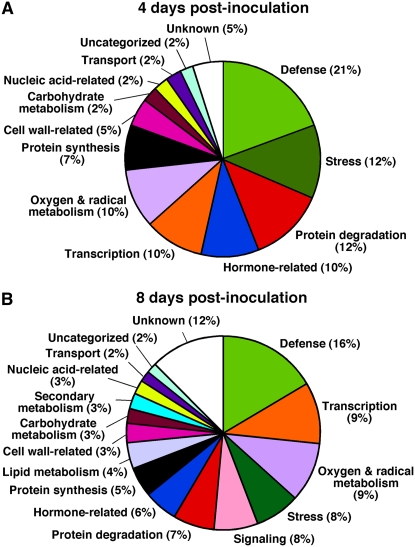
Figure 3.
Classification into functional categories of genes differentially expressed between stem tissues of tomato plants infected with Cmm and those of mock-inoculated ones. A and B, Pie charts show classification and percentage of functional categories for 41 and 120 genes differentially expressed at 4 and 8 dpi, respectively.

