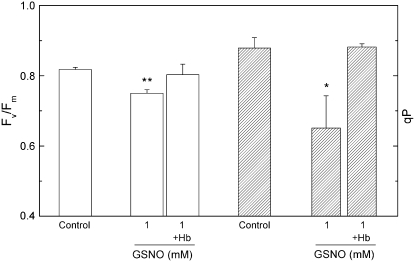
Figure 3.
The effect of GSNO on Fv/Fm and on steady-state qP. Prior to measurements, leaf discs were incubated for 2 h under 150 μmol m−2 s−1 white light in distilled water (Control) and 1 mm GSNO solution, then dark adapted for 15 min. The NO scavenger Hb was applied at a concentration of 4 mg mL−1. Steady-state qP values were recorded at the end of a 30-min 130 μmol m−2 s−1 red actinic illumination. Bars represent means ± sd (n = 4). Asterisks indicate levels of significance: P < 0.05 (*) and P < 0.01 (**).

