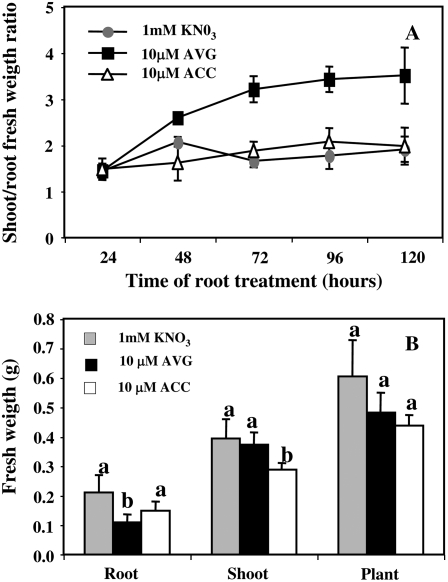
Figure 5.
A and B, Changes in shoot-root fresh biomass ratio (A) and FW (B) in oilseed rape seedlings treated for 120 h with 10 μm ACC and 10 μm AVG under homogeneous feeding of N (1 mm). Vertical bars indicate average values ± se of n = 3 to 15 repeats of the sum of four seedlings each when larger than the symbol. Data were analyzed by the nonparametric test of Kruskall Wallis. Then, Mood median tests were to compare means or medians; bars sharing different letters are significantly different at P = 0.05 (Sokal and Rohlf, 2003).

