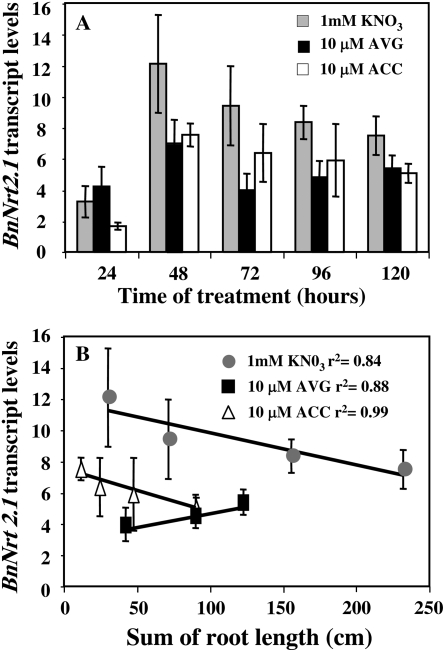
Figure 9.
A and B, Expression patterns of BnNrt2.1 transcripts in root (A) and correlation between BnRT2.1 transcript levels and total roots length in 10 μm ACC or 10 μm AVG-treated seedlings under homogeneous feeding of 1 mm N in oilseed rape seedlings (B). Vertical bars indicate ± se for n = 4 experiments with a bulk of four seedlings when larger than the symbol.

