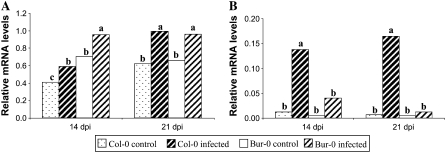
Figure 4.
Relative transcript levels of the genes ARGAH1 (A) and ARGAH2 (B) encoding arginase in noninfected (control) and infected roots of the susceptible accession Col-0 and the partially resistant accession Bur-0 at 14 and 21 dpi. Values were obtained by real-time quantitative RT-PCR and are normalized to the host Actin8 gene. Samples of control and infected roots were analyzed in duplicate in four independent experiments. For each time point, same letters indicate nonsignificant difference at P = 0.05.

