
Figure 1.
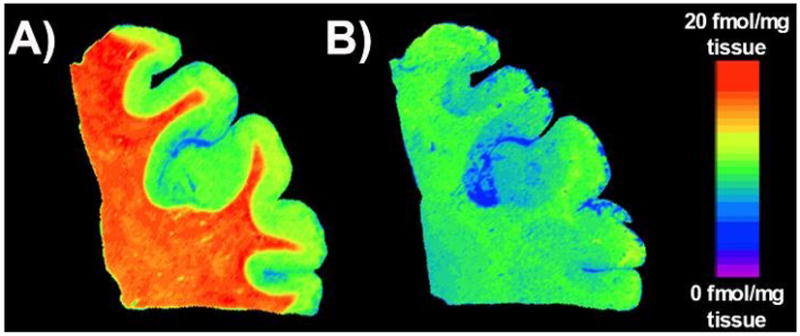
Representative pseudocolor autoradiographic images of [125I]DCIT binding to frontal cortex brain tissue. A) Image represents levels of [125I]DCIT total binding and B) is representative of [125I]DCIT nonspecific binding using 2-PMPA as a selective blocker of [125I]DCIT binding to GCPII.