
Figure 3.
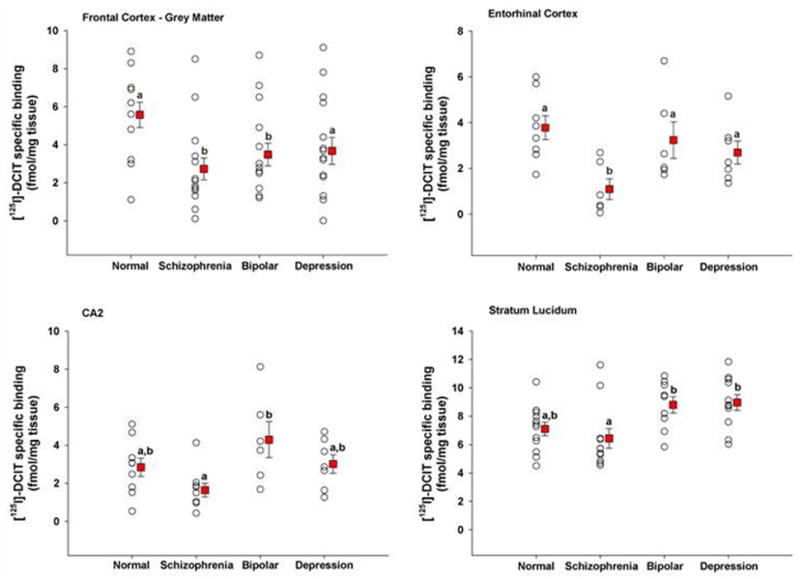
Scatter plots of [125I]DCIT specific binding to brain regions in which significant differences were noted amongst patient groups. Within a brain region, groups with different letters are significantly different from each other at p < 0.05. Values are expressed as mean ± s.e.m.