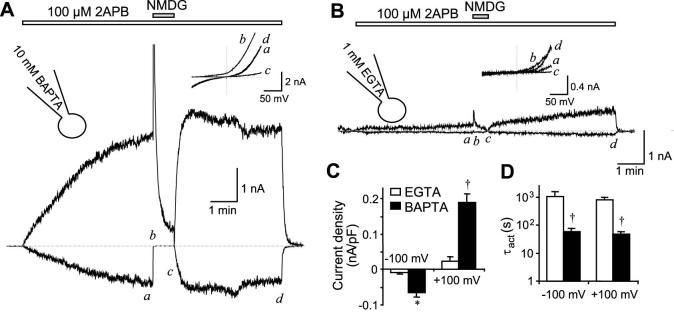
Figure 1. Effect of intracellular Ca2+ buffering strength on the activation of TRPV3 by 2APB.
TRPV3-transfected HEK293 cells were held in whole cell mode at 0 mV with pipette solution containing either 10 mM BAPTA (A) or 1 mM EGTA (B). Voltage ramps were applied from -100 to +100 mV in 100 ms after a 20-ms step pulse to -100 mV every 0.5 s. 2APB (100 μM) was applied continuously as indicated by the bars above the current traces, which represent current development at -100 mV (below dashed lines) and +100 mV (above dashed lines). Dashed lines show zero current. Insets show current-voltage (I-V) relationships obtained from the voltage ramp at the time points indicated in the current traces. C and D show summary data (n = 5 for EGTA, n=16 for BAPTA) of current densities at 100 sec after 2APB application (C) and time constants (τact) obtained from exponential fits (D) of current developed at -100 and +100 mV using pipettes that contained either 1 mM EGTA (open bars) or 10 mM BAPTA (filled bars). Note, logarithmic scale is used in D to accommodate the large difference between data values. * p < 0.05, † p < 0.001, different from EGTA.

