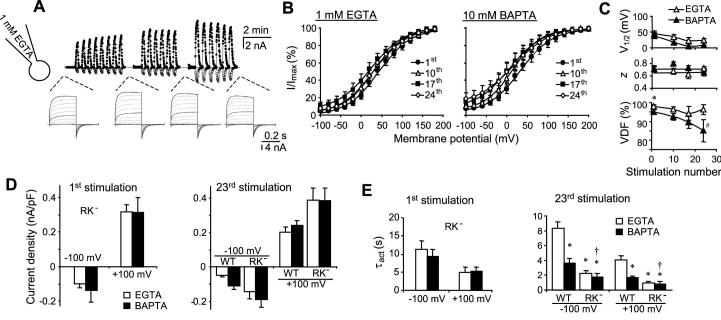
Figure 6. Voltage dependence of TRPV3RK- mutant in response to repetitive 2APB stimulations.
A, a representative experiment performed as in Fig. 3A except that the cell expressed TRPV3RK-. B and C, G-V relationships for TRPV3RK- were obtained from tail currents as in Figs. 3C and 3D. No significant change was found between the EGTA and BAPTA internal solutions except for some small changes in VDF. * p < 0.05 different from BAPTA; # p < 0.05 different from the first stimulation. D and E, peak current densities (D) and τact (E) at -100 and +100 mV elicited by the first (left panels) and 23rd (right panels) applications of 100 μM 2APB to HEK293 cells that expressed TRPV3RK- (RK-). Data obtained from wild type TRPV3 (WT) for the 23rd stimulation are included for comparison. The internal solution contained either 1 mM EGTA (open bars) or 10 mM BAPTA (filled bars). Currents were recorded using the voltage ramp protocol. τact was obtained by fitting the data points from 0.5 to 12 sec (or the time at the peak current) following 2APB application. n = 5-11 cells. * p < 0.01 different from WT/EGTA, † p < 0.05 different from WT/BAPTA.

