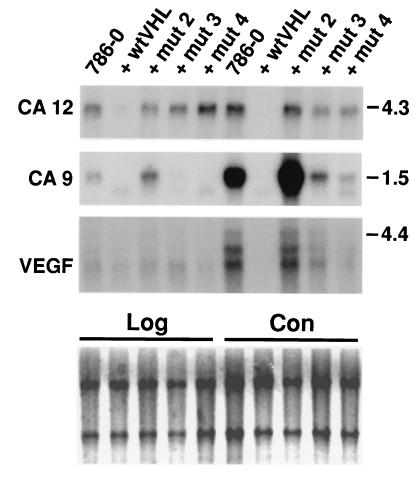
Figure 3.
Northern analysis of target genes in growing (Log) and late confluent (Con) 786–0 cells transfected with wt or mut 2, mut 3, and mut 4 pVHL-containing plasmids. Quantification of hybridization signals was done by using the PhosphorImager system (Molecular Dynamics). Before hybridization the blots were stained with methylene blue (Lower) to show approximately equal loading of the RNA samples (see also Materials and Methods). Numbers on the right represent size markers in kb.

