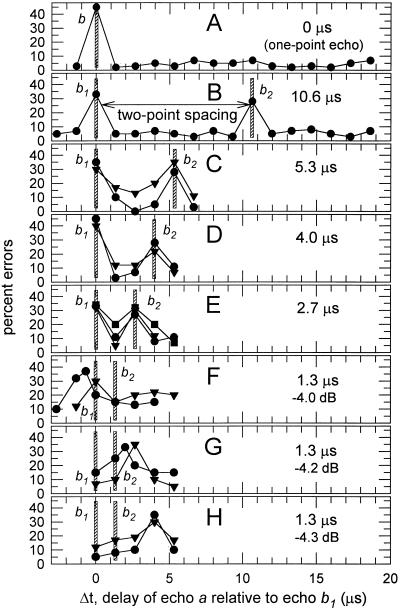
Figure 3.
(A–H) Performance of bats in a series of different jitter experiments with two-point spacings of 0 μs, 10.6 μs, 5.3 μs, 4.0 μs, 2.7 μs, and 1.3 μs. (Each experiment as in Fig. 1B; successive experiments as in Fig. 1C.) Curves in each plot trace percentage errors in 40–60 trials as function of delay of single jittering echo a relative to delay of echo b1 (i.e., Δt) regardless of spacing between b1 and b2. Data points are filled circles for bat 3, filled squares for bat 4, and filled triangles for bat 5 (13). Vertical crosshatched bars mark locations of echoes b1 and b2 relative to delays of a in each experiment. Curves contain separate error peaks for b1 and b2 until two-point spacing declines to 1.3 μs, where only one error peak is present (see text). Three different plots show 1.3-μs performance curves for different relative amplitudes of b1 + b2 (F, −4.0 dB; G, −4.2 dB; H, −4.3 dB).

