Figure 3.
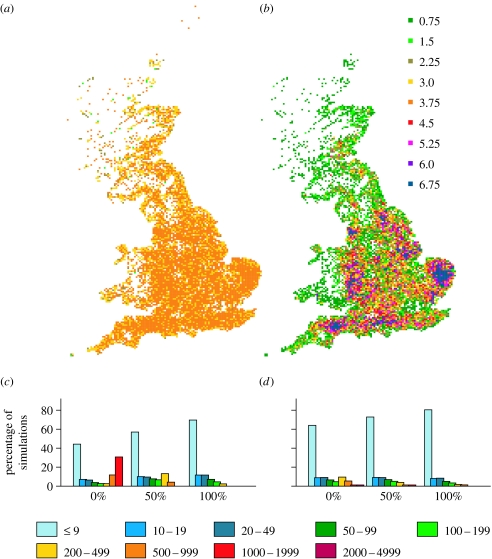
(a) Risk maps with density-independent spatial transmission and a premise size-independent transmission rate. Colours denote the local R0. (b) as (a) but with density-dependent spatial transmission and a premise size-dependent transmission rate. (c) Final size of simulated epidemics with all current planned interventions for various proportions of density-dependent spatial transmission (indicated on the x-axis) with premise size-independent transmission rate. (d) as (c) but with premise size-dependent transmission rate. Bars show the percentage of simulations that fall into the various size categories. All epidemics were seeded at a single randomly drawn premise. All runs are for mean R0=3 and for purely spatial transmission.

