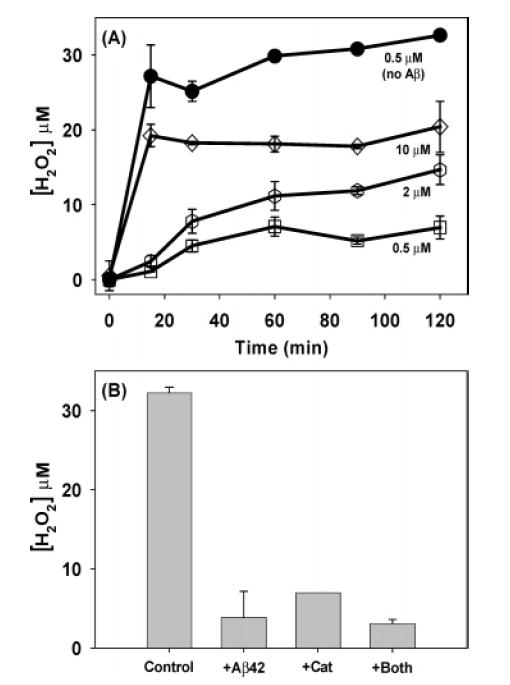
Figure 3.

H2O2 production. (A) Effect of copper concentration (0.5, 2, 10 μM) on H2O2 production in the presence (open symbols)and absence (filled symbols) of Aβ42. (B) Effect of Aβ42 andcatalase on H2O2 production at 120 min. The Aβ42 concentrationwas 5 μM (when present) and the ascorbate concentration was 50 μM for all of the data in both panels.
