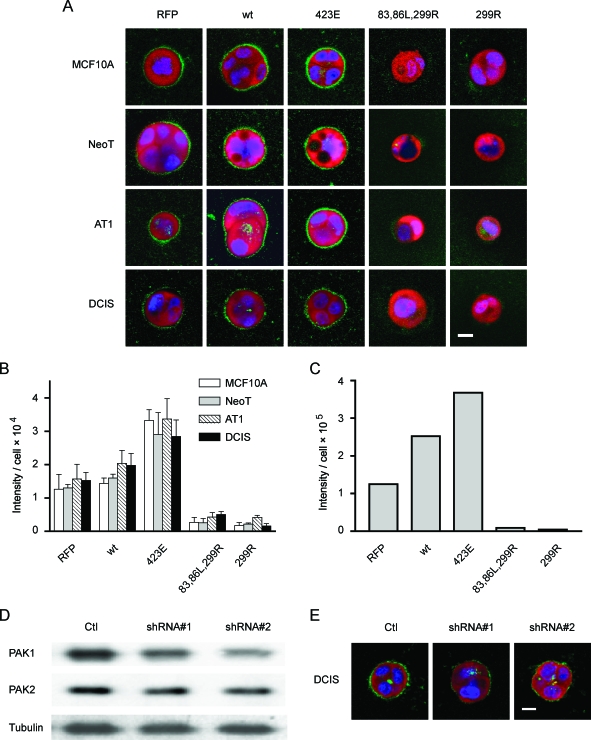
Figure 7.
PAK1 regulates pericellular proteolysis in the MCF10 progression series grown in 3D rBM overlay cultures. (A and B) MCF10 series cells were infected with control retroviruses that only expressed RFP, or bicistronic constructs expressing RFP plus wild-type PAK1 (wt), CA-PAK1 (423E), or two forms of DN-PAK1 (83,86L,299R or 299R) and cultured for 2 days in Matrigel plus DQ-collagen IV. The nuclei of live cells were stained with DRAQ5 for 30 minutes, and then confocal immunofluorescent images were taken. (A) Expressions of retroviral constructs (red) and nuclei (blue) are shown in equatorial sections of the cells along with the associated cleavage of DQ-collagen IV (green). Scale bar, 10 µm. (B) Quantification of the green signals from the equatorial cross-sections of three to eight structures for each condition. The data are presented as average pixel intensity per cell, with cell number determined by counting of DRAQ5-labeled nuclei. CA-PAK1 significantly increased pericellular proteolysis, and both DN-PAK1 constructs significantly inhibited pericellular proteolysis, compared to RFP control structures, in all cell lines (P < .05). (C) Representative quantification of the green signal from 3D reconstructions of the MCF10A experiments shown in (A). The data are presented as average voxel intensity per cell from the entire structure. Cell number was determined by counting the DRAQ5-labeled nuclei in z-stacks through the structures. (D and E) DCIS cells were infected with dual sequence retroviruses that expressed RFP plus a control shRNA sequence (Ctl), or plus two forms of shRNA designed to decrease PAK1 expression (shRNA #1 and shRNA #2) and cultured for 2 days. (D) DCIS Cell lysates were subjected to immunoblot analysis for PAK1 to assess knock down and were stripped and reprobed for PAK2 to assess specificity. Quantification of results from two independent experiments demonstrated that the shRNA #2 sequence decreased PAK1 expression by 55%. (E) Transduced DCIS cells were cultured in Matrigel containing DQ-collagen IV for 3 days, and images were prepared from equatorial sections of the structures for cleavage of DQ-collagen IV (green), nuclei (blue), and expression of retroviral constructs (red). Data are representative of results from two independent experiments. Scale bar, 10 µm.

