Figure 2.
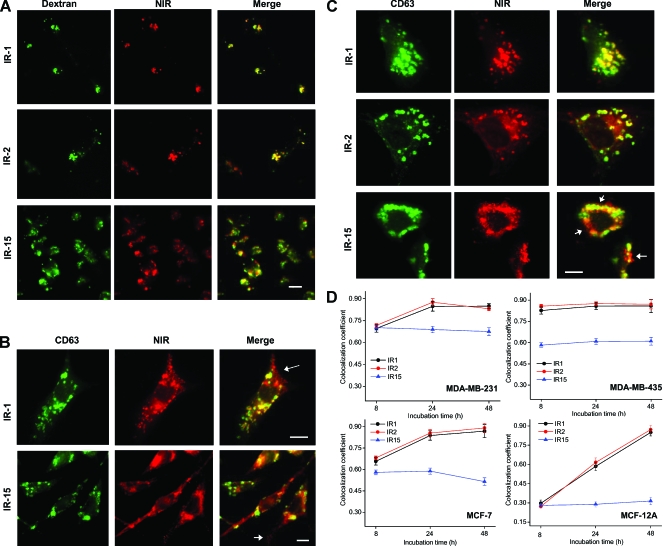
Glucosamine-bound NIR probes demonstrated lysosome specificity in HMEC lines. (A) Representative fluorescence images of live MDA-MB-231 cells treated with the lysosome marker Alexa Fluo-488-conjugated dextran (50 µg/ml) and subsequently with 20 µM IR-1, IR-2, or IR-15 for 24 hours. The NIR fluorescence is displayed in red, and the Alexa Fluo-488 fluorescence is displayed in green. Colocalization of NIR probe and dextran is indicated by yellow in the merged image. Scale bar, 20 µm. These images were acquired with a 60x oil immersion objective. (B) Representative fluorescence images of MDA-MB-231 cells that were treated 20 µM IR-1 or IR-15 for 8 hours, fixed, and followed by immunofluorescence staining with CD63 antibody. These images were acquired with a 100x oil immersion lens. The NIR fluorescence is displayed in red, and the CD63 immunofluorescence is in green. Yellow indicates colocalization of NIR probe and CD63. Arrows point to single-stained vesicle structures at the periphery of cells. Scale bar, 15 µm. (C) Representative fluorescence images of MDA-MB-231 cells that were treated with 20 µM IR-1, IR-2, or IR-15 for 24 hours, fixed, and followed by immuno-fluorescence staining with CD63 antibody. Arrows point to single-stained vesicle structures. Scale bar, 15 µm. (D) The colocalization coefficients of NIR fluorescence with CD63 immunofluorescence were quantified in HMECs after incubation with NIR probe for 8, 24, or 48 hours. The colocalization coefficients were determined from five to six randomly selected images. All images were acquired with a 40x oil immersion lens, and totally 120 to 200 cells were assessed. Data represent a minimum of three independent experiments. Data points indicate the mean; bars, SD.

