Figure 1.
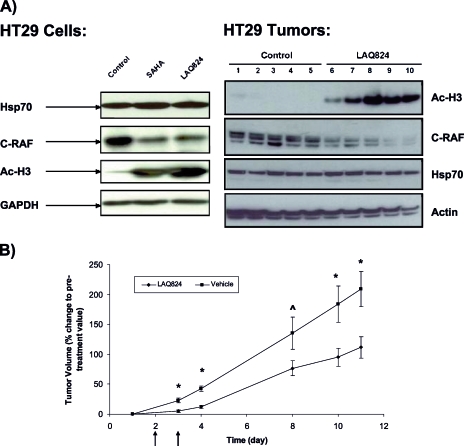
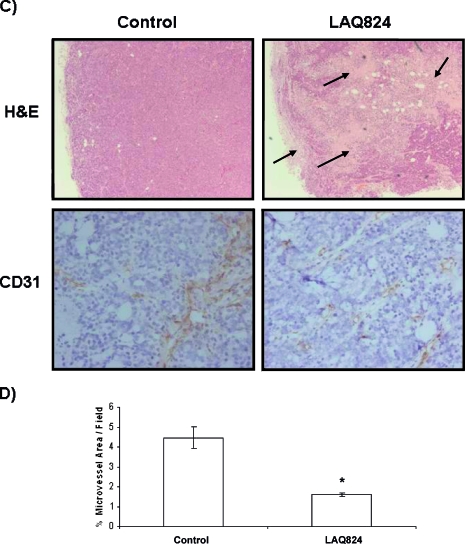
LAQ824 causes induction of histone acetylation and reduction of C-RAF expression, tumor growth delay, extensive tumor necrosis, and reduction of microvessel density in HT29 tumor model. (A) Western blots for Hsp70 and C-RAF expression and histone (H3) acetylation are shown in HT29 cells after treatment with vehicle (left lane), 34 µM SAHA [20 x GI50] (middle lane), and 350 nM LAQ824 [10 x GI50] (right lane) for 24 hours (left panel). Western blots for histone (H3) acetylation and C-RAF and Hsp70 expression are shown in HT29 xenografts following daily (x2) i.p. injection of vehicle (10% DMSO and 90% of 5% dextrose in water) (lanes 1–5) and 25 mg/kg LAQ824 i.p. (lanes 6–10) (right panel). (B) Percentage change in tumor volumes (tumor volume post-LAQ824 or -vehicle treatment relative to pretreatment volume) over time are shown in HT29 xenografts following daily (x2) i.p. injection of vehicle (10% DMSO and 90% of 5% dextrose in water) and 25 mg/kg LAQ824 i.p. Vehicle-treated (filled squares; n = 18 at days 1, 3, and 4 and n = 5 at days 8, 10, and 11) and LAQ824-treated group (filled diamonds; n = 20 at days 1, 3, and 4 and n = 5 at days 8, 10, and 11) are shown in the graph. Treatment days are shown by black arrows. Results are expressed as mean ± SEM. Two-tailed unpaired t test was used to compare changes between the vehicle- and LAQ824-treated groups. *P ≤ .03 and ^P = .08 when comparing LAQ824-treated with vehicle controls. (C) Hematoxylin and eosin (H&E) staining for necrosis (top panels; original magnification, x40) and immunohistochemical staining of CD31 for endothelial cells are shown (blood vessels are in brown) (bottom panels; original magnification, x200) in HT29 xenografts after daily (x2) i.p. injection of vehicle (10% DMSO and 90% of 5% dextrose in water) (left panels) and 25 mg/kg LAQ824 i.p. (right panels). Some areas of necrosis are shown by the black arrows. (D) Quantitative analysis of microvessel density was performed in LAQ824- and vehicle-treated tumors using analySIS (Soft Imaging System GmbH). Results are expressed as percent microvessel area per field, mean ± SEM. Two-tailed unpaired t test was used to compare changes between the vehicle- (n = 2) and LAQ824-treated groups (n = 3). *P = .007 when comparing LAQ824-treated with vehicle controls.


