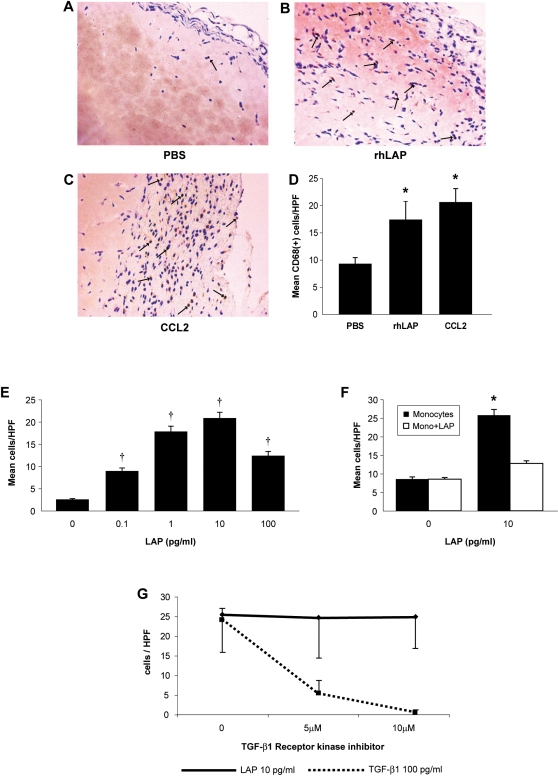
Figure 1. Latency-associated peptide (LAP) induces monocyte chemotaxis via a pathway distinct from TGF-β1.
C57BL/6 female mice were anesthetized and subcutaneously injected with Matrigel™ matrix supplemented with PBS, rhLAP or CCL2/MCP-1. After 10 days the mice were sacrificed, skinned, and the plugs were removed, fixed and embedded in paraffin then stained for CD68+ cells (mononuclear phagocytes). Matrigel matrix supplemented with (A) PBS, (B) 10 pg/ml rhLAP, or (C) 10 ng/ml CCL2 were assessed for CD68+ cell recruitment and then quantified by blinded counts (D). Arrow heads indicate CD68+ cells. (*p<0.05 for condition vs. PBS control plugs, n = 3 for CCL2 and n = 2 for LAP) Human monocytes (5×10⁴/condition) were suspended in Gey's balanced salt solution and assayed for their chemotactic response to rhLAP. Recruitment was assayed by incubating monocytes in modified Boyden chambers for 90 minutes at 37°C and quantified by counting five high-powered fields of stained membranes in a blinded fashion. (E) Increasing doses of rhLAP (0-100 pg/ml) were used to stimulate monocyte recruitment (†p<0.001 from the non-stimulated sample, n = 7). (F) Analysis for evidence of directed recruitment of monocytes by LAP was assessed by exposing monocytes to a “true” gradient of rhLAP (10 pg/ml) (rhLAP in the chamber opposite the monocytes only; dark bars–“Monocytes”) or no gradient (rhLAP on both sides of the chamber; lighter bars–“Monocytes+LAP”). These data represent two independent studies done in triplicate (*p<0.001 vs. mono + LAP condition). (G) Assessment of LAP-specific chemotaxis was performed by pre-incubating cell suspensions with the SB 431542 hydrate from Sigma (St.Louis, MO), a selective inhibitor of TGF-β type 1 receptor kinases (Activin Receptor-Like Kinases, ALK-4,-5, and-7) 20 minutes prior to loading on chemotaxis chambers. Monocytes were then exposed to optimal chemotactic doses of LAP (10 pg/ml) and TGF-β1 (100 pg/ml). All bars represent the mean±SEM for n = 4 samples (* p<0.05 by ANOVA with post-hoc testing).

