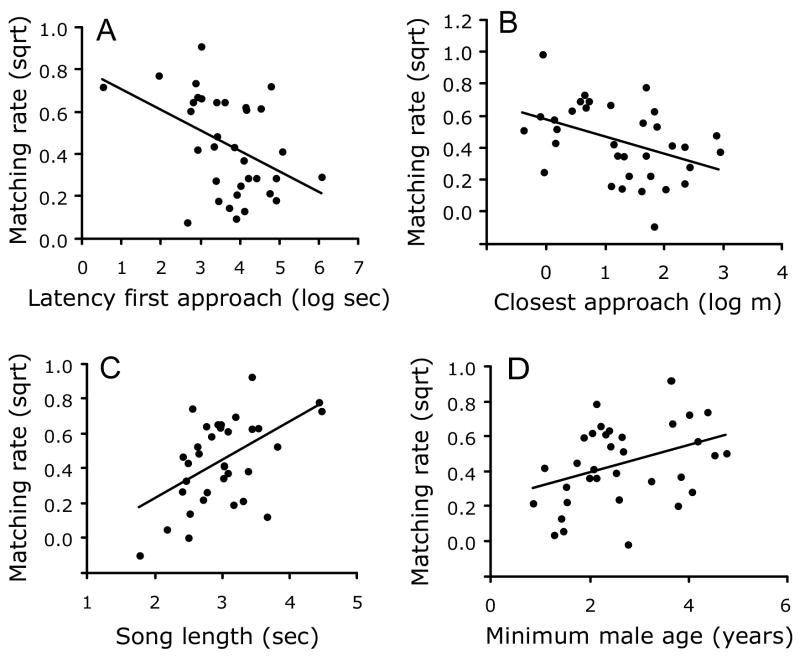
Figure 1.
Significant effects associated with matching rate during playback; all graphs show leverage residuals for x and y axes. (A) Matching rate as a function of latency to first approach, showing higher matching associated with more rapid approach. (B) Matching rate as a function of closest approach to the speaker, showing higher matching associated with closer approach. (C) Matching rate as a function of song length. (D) Matching rate as a function of male age, showing increased matching for older males.

