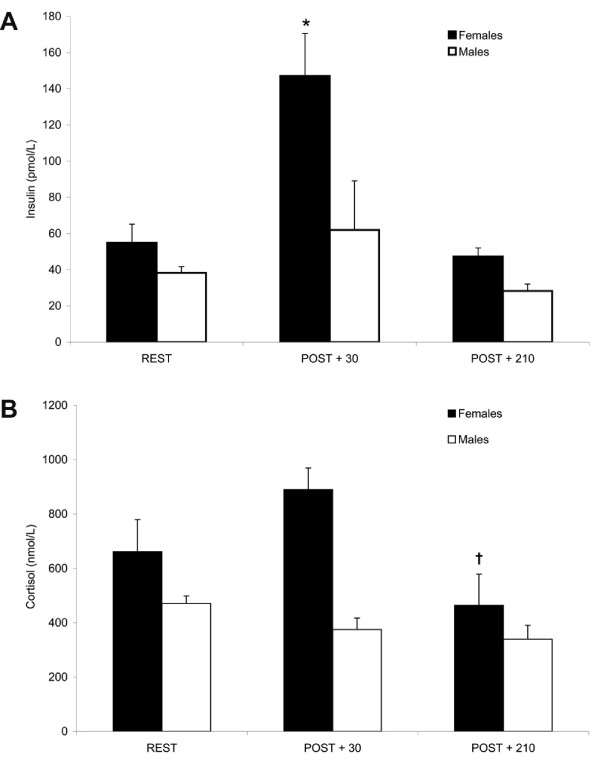
Figure 2.
Plasma insulin (A) and cortisol (B) concentrations prior to and during recovery from endurance exercise. Gender differences existed in the insulin and cortisol responses post-exercise. Values expressed as mean ± SEM. REST, prior to exercise; POST + 30, 30 min post-exercise; POST + 210, 210 min post exercise). * Different from REST and POST + 210 in females, P < 0.01; † Different from POST + 30 in females, P < 0.05.

