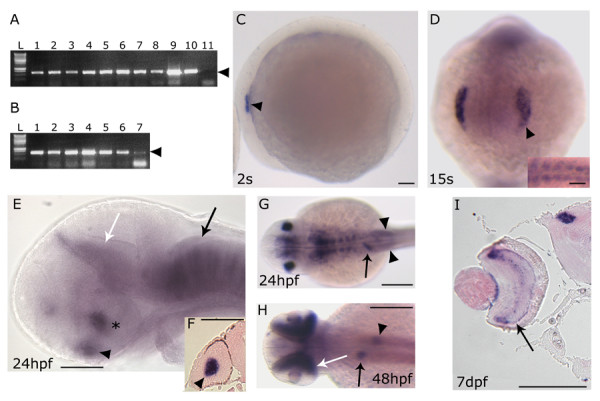
Figure 1.

prox1 temporal and spatial expression pattern analyzed by RT-PCR and in situ hybridization. (A) RT-PCR performed on different embryonic stages: 1–2 cells stage (lane 1), 30% epiboly (lane 2), 50% epiboly (lane 3), 80% epiboly (lane 4), tail bud (lane 5), 8 somites (lane 6), 15 somites (lane 7), 24 hpf (lane 8), 72 hpf (lane 9), 5 dpf (lane 10) and negative control (lane 11) in the absence of cDNA. (B) RT-PCR performed on different adult organs: DNA ladder (L), testis (lane 1), overy (lane 2), gills (lane 3), gut (lane 4), eye (lane 5), brain (lane 6) and liver (lane 7). Arrowhead indicates the size of the prox1-specific PCR product (620 bp). (C-I) prox1 WISH (C) the first signals appeared at 2 s in the otic placode (arrowhead). (D) at 15 s the signal is detected in the lens placode (arrowhead), and somites (inset). (E) at 24 hpf prox1 is expressed the hypothalamus (asterisc), the pituitary (black arrowhead), the pretectal segment (prosomere 1) (white arrow), as well as segmentally arranged cells of the hindbrain (black arrow). (F) transverse section through the forebrain of a 24 hpf stage zebrafish embryo shows the signal in the lens (black arrowhead). (G) at 24 hpf additional prox1 signals are present in the liver primordium (arrow), and posterior lateral line primordium (arrowheads). (H) later during development, (48 hpf) prox1 expression is detected in distinct domains in the liver (arrow) and pancreas (arrowhead), while a further signal appeares in the retina (white arrow). (I) transverse section through the forebrain of a 7 dpf stage zebrafish larva shows the signals in the retina inner nuclear layer (arrow) and in the pretectal nuclei (arrowhead). (C,E) Lateral views are shown. (D) Frontal view is shown. (G,H) Dorsal views are shown. Anterior is always to the left. Scale bars indicate 100 μm (A,B,C,D,G,H,I) or 200 μm (E,F).
