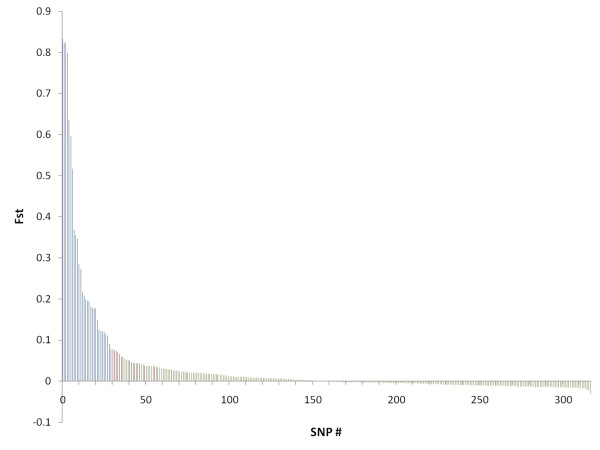
Figure 3.
FST values from locus-by-locus AMOVA. FST values were calculated at individual markers, with a three-population structure (North-East Artic cod (NCC), Norwegian coastal cod north (NCC-N), and Norwegian coastal cod south (NCC-S)). Blue columns = outlier loci according to the Beaumont and Nichols [29] test (Figure 4); red columns = non-outlier SNPs with FST values significantly different from zero; green columns = SNPs with FST values not significantly different from zero.

