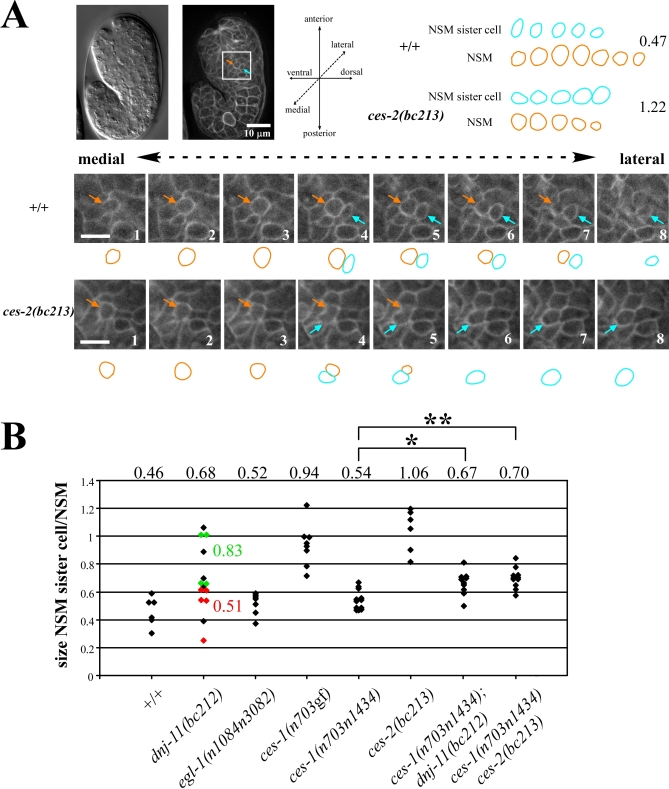
Figure 3. dnj-11, ces-1, and ces-2 Are Involved in Asymmetric NSM Neuroblast Division.
(A) (Left top) Nomarski and epifluorescence image of a wild-type embryo transgenic for the transgene Ppie-1gfp::ph(PLC1δ1) immediately after the NSM neuroblast divided. The orange arrow points to the NSM, the blue arrow points to the NSM sister cell. (Bottom) Series of eight consecutive focal planes (0.5 μm distance) (1–8) through the NSM and NSM sister cell of a wild-type (upper panel, +/+) or ces-2(bc213) (lower panel, ces-2(bc213)) embryo. (Right top) Summary of schematic representations of the outlines. Numbers on the right indicate the ratios between the sizes of the NSM sister cells and the NSMs in the Z-series shown.
(B) The ratio of the sizes of the NSM sister cell and the NSM was determined as described in Materials and Methods. The NSM sister cell was defined as the lateral cell of the two daughter cells. Each diamond represents the ratio of a single, independent NSM neuroblast division. The numbers above the diamonds represent the average ratio obtained for a given genotype. The apoptotic fate of the NSM sister cells was determined in a subset of dnj-11(bc212) embryos (red/died, green/survived). The complete genotypes of the embryos analyzed from left to right were: tIs38 (Ppie-1gfp::ph(PLC1δ1)), dnj-11(bc212) bcIs25; tIs38, egl-1(n1048n3082); tIs38, ces-1(n703gf); tIs38, ces-1(n703n1434); tIs38, ces-2(bc213); bcIs25; tIs38, ces-1(n703n1434); dnj-11(bc212) bcIs25; tIs38, and ces-1(n703n1434) ces-2(bc213); bcIs25; tIs38. p-Values were determined by the Student's t-test. *ces-1(n703n1434) compared to ces-1(n703n1434); dnj-11(bc212): p<0.002, **ces-1(n703n1434) compared to ces-1(n703n1434) ces-2(bc213): p<0.001.

