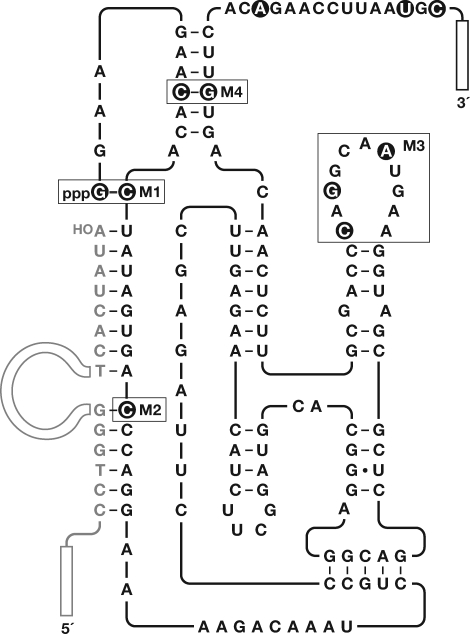
Figure 3. Evolution of Genotype.
The diagram shows the sequence and secondary structure of the final evolved ligase enzyme. The oligonucleotide substrate is shown in gray, specifying those residues that bind to the template region of the RNA enzyme. The primer binding sites at the 3′ end of the enzyme and 5′ end of the substrate are indicated by open rectangles. Mutations that were present in all sequenced clones are highlighted by black circles. Critical mutations, designated M1, M2, M3, and M4, are indicated by boxes.

