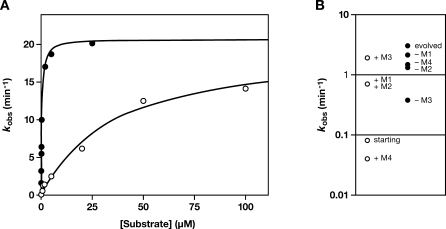
Figure 4. Evolution of Phenotype.
Catalytic activity was measured for the starting (open circles) and final evolved (filled circles) enzymes.
(A) The observed rate constant, k obs, was determined for various concentrations of substrate and fit to the Michaelis-Menten equation.
(B) Values for k obs were obtained in the presence of 0.1 μM substrate for variants of the starting enzyme that contained each of the four critical mutations (left) and for variants of the evolved enzyme that lacked each of these mutations (right).

