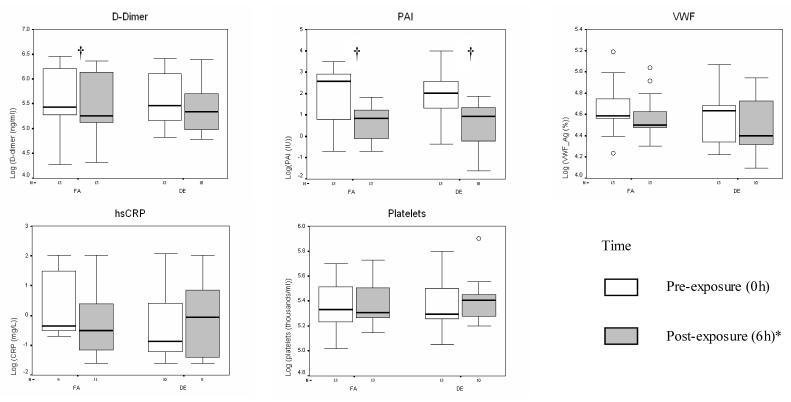
Figure 1.
Coagulation marker changes from 0 to 6 hours* post-exposure, by exposure level. Each panel depicts medians (bars) and interquartile ranges (whiskers) for each marker associated with given dose and time point (see legend); † 0 versus 6 hour* fold-change significant at p<0.05 (paired t-test); * Except hsCRP (22h); open circles represent data points outside of interquartile range; FA = filtered air; DE = 200μg/m3 (PM2.5) diesel exhaust.

