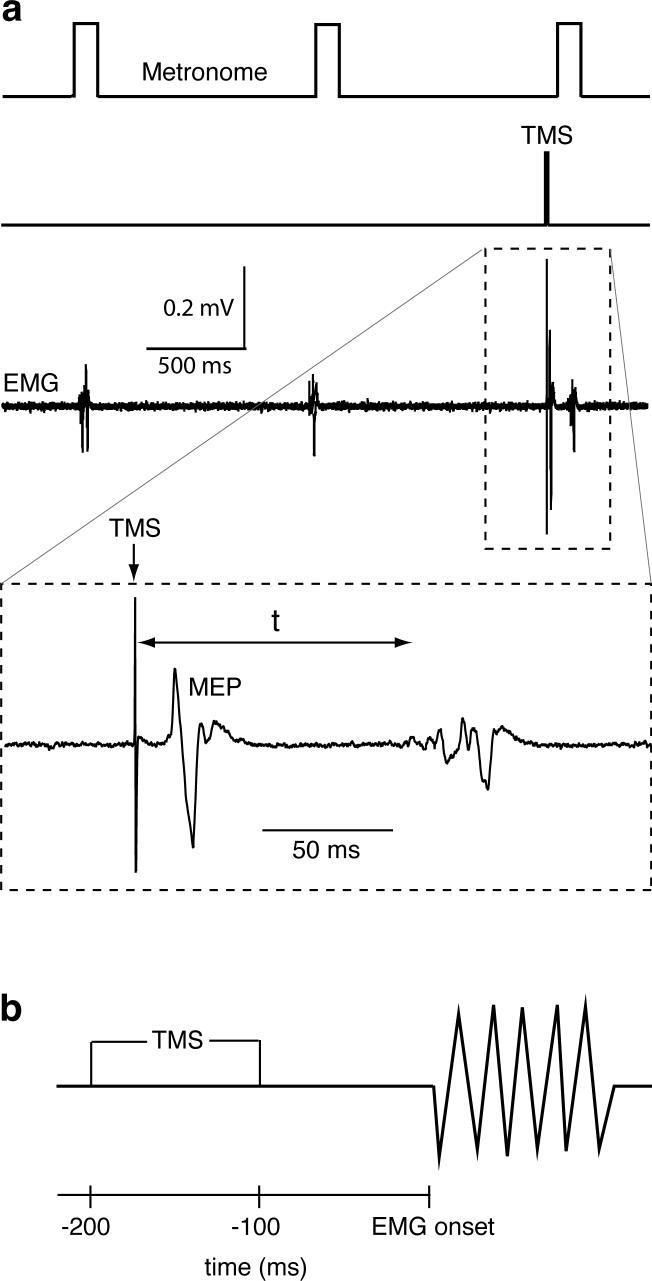
Fig. 1.
a) Schematic depicting the temporal relationship between three metronome signals (1st trace), a TMS trigger (2nd trace), and three short duration EMG bursts recorded from BB (3rd trace), as stroke patient IV performed a sequence of elbow flexor contractions. The 4th trace shows a TMS-induced MEP in BB prior to BB contraction on an expanded time scale. “t” indicates the time interval from TMS to the agonist burst onset. b) TMS was delivered in a pre-contraction window between 200 and 100 ms prior to agonist burst onset.

