Figure 3.
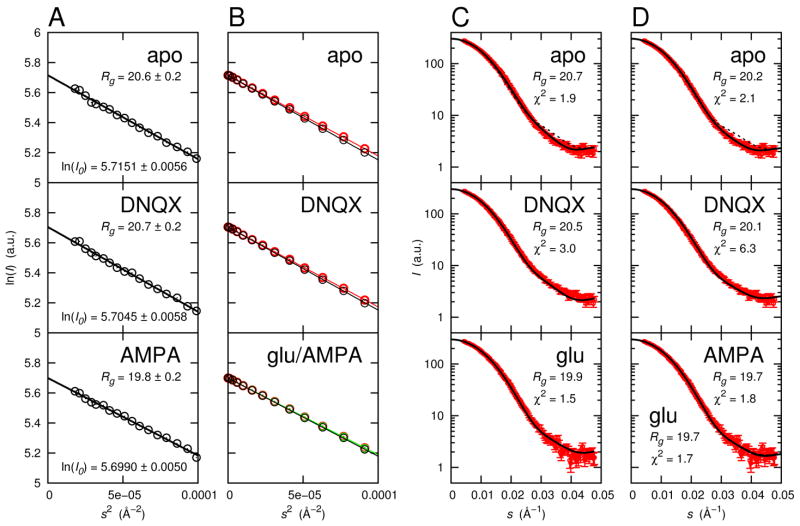
Small-angle X-ray scattering. (A) Rg for the apo, DNQX-, and AMPA-bound S1S2 were obtained by fitting experimental SAXS profiles (Madden et al., 2005) to the Guinier law in the range 2πsRg < 1.3. (B) Rg obtained by fitting calculated scattering profiles to the Guinier law in the same range. Rg values are shown in (C) and (D). Ensemble average scattering profiles from simulations (black) are compared with scattering profiles calculated from X-ray crystal structures (PDB 1FTO (apo, red), 1FTL (DNQX, red), 1FTM (AMPA, red), 1FTJ (glu, green)). Calculated scattering are shown as circles and Guinier fits are shown as lines. The calculated curves were scaled such that I0 matched those obtained for the experimental curves. The AMPA and glu crystal results are nearly indistinguishable. (C) Comparison of ensemble average scattering profiles from simulations (black lines) with experimental profiles (red circles). Error bars in the experimental data indicate standard deviation. Rg for the calculated scattering profiles and χ2 (evaluated using all experimental data) are shown. The dashed line in the apo panel is the scattering profile that results when binding cleft waters are omitted from the scattering calculations. In the bottom panel, the calculated scattering profile for the glutamate-bound S1S2 is compared with experimental data for AMPA-bound S1S2. (D) Comparison of scattering profiles calculated from X-ray crystal structures with experimental profiles (red circles). Crystallographically unresolved protein termini and sidechains were built into the models since they contribute to X-ray scattering. Rg for the calculated scattering profiles and χ2 (evaluated using all experimental data) are shown. As in (C), the dashed line in the apo panel is the scattering profile that results when binding cleft waters are omitted from the scattering calculations. In the bottom panel, experimental data for the AMPA-bound S1S2 is compared with calculated scattering profiles for both AMPA-bound (solid line) and glutamate-bound (dashed line) S1S2.

