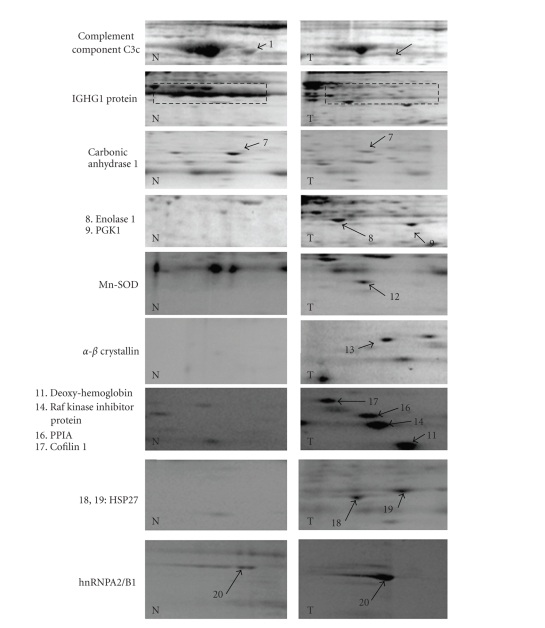
Figure 1.
2-DE pattern of proteins from tumor and nontumor samples resolved by NEPHGE 2-DE and listed in Table 1. Proteins dysregulated in tumor tissues (T) as compared to nontumor tissues (N) are highlighted with arrows. The numbers indicated correspond to those given in Table 1. (1)–(7): proteins downregulated in tumor tissues; (8)–(20): proteins upregulated in tumor tissues. (1) complement component C3c; (2)–(6) IGHG1 protein isoforms; (7) carbonic anhydrase 1; (8) enolase 1; (9) phosphoglycerate kinase 1 (PGK1); (10), (11) hemoglobin; (12) MnSOD; (13) α-B crystallin; (14) Raf kinase inhibitor protein; (15), (16) peptidylprolylisomerase A (PPIA); (17) cofilin 1; (18), (19) HSP27; (20) hnRNP A2/B1.

