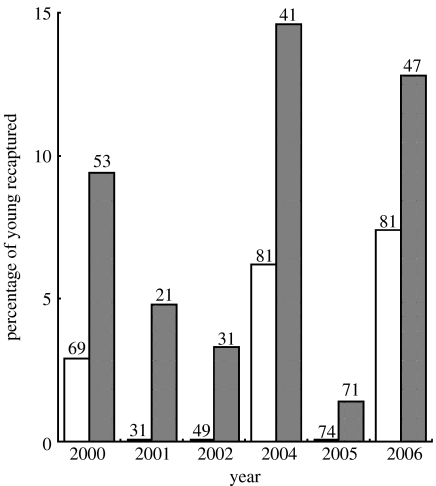
Figure 2.
The percentage of fledglings recaptured in different years. In all years a larger percentage of EPY (grey bars) compared with WPY (white bars) was recaptured. Pooled data over all years show that more EPY were recaptured (WPY 3.4% (13/385), EPY 7.6% (20/264); Fisher's exact test p=0.02). The numbers above bars are the number of ringed nestlings.

