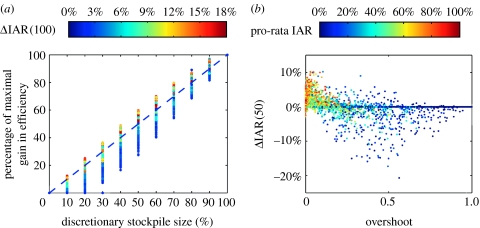
Figure 5.
(a) The percentage of maximal gain in efficiency (i.e. ΔIAR(100)) realized by a discretionary policy is an increasing function of its discretionary stockpile size d. This figure is generated as follows: for each stockpile size d, the quantity ρ(d)=ΔIAR(d)/ΔIAR(100) is computed for a 51 by 51 rectangular grid of the (R0, c) plane. The colour of each point is colour-coded by the corresponding value of ΔIAR(100) using the same colour key in figure 2 (repeated here). The d–ρ(d) relation, which varies with (R0, c), can be visualized by connecting points of the same colour. (b) To perform a multivariate sensitivity analysis on the 50% discretionary policy, we generate 5000 sets of model parameters in the ranges shown in table 1 using Latin hypercube sampling. Since inter-regional mixing is weak, the critical coverage , i=1, …, K, are close to that when there is no inter-regional mixing, which are given by , i=1, …, K, where is the basic reproductive number in region i and is the overall vaccine efficacy. Therefore, given an allocation (α1, …, αK), the degree of overshoot can be accurately measured by which is the proportion of stockpile misallocated due to overshooting when inter-regional mixing is zero. ΔIAR(50) drops sharply as the degree of overshoot increases. Each point of ΔIAR(50) is colour-coded by ΔIAR(0), which is the IAR under pro-rata. Overshoot is more likely when pro-rata IAR is low. That is, overshoot is more likely when the impact of the pandemic is relatively mild in the presence of pre-pandemic vaccination. ΔIAR(50) drops far below zero when there is overshoot and pro-rata IAR is below 50%.

