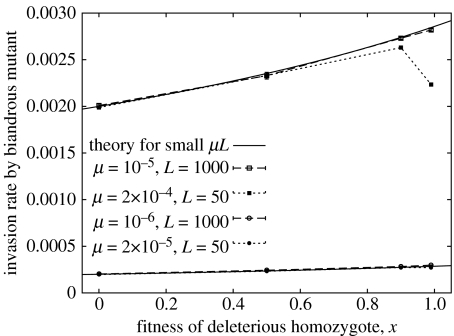
Figure 2.
Invasion rates for a biandrous mutant into an infinite monandrous population. The solid lines show the theoretical prediction , valid for small μL. The upper data have μL=10−2 and the lower data have μL=10−3; open symbols and dashed lines have L=1000 recessive loci, filled symbols and dotted lines have L=50 recessive loci.

