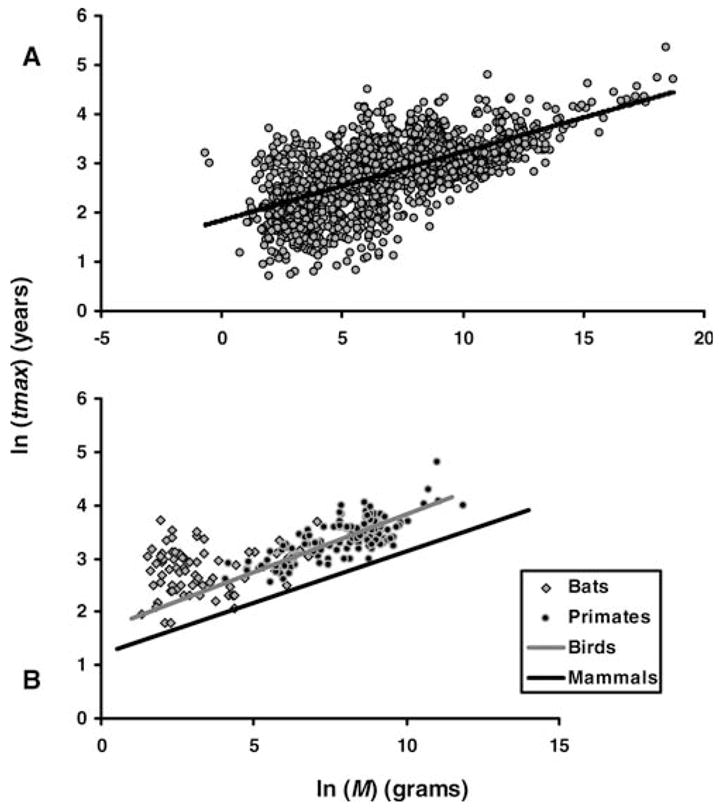
Figure 1.

Plot of the ln-transformed relationship between body mass (M) and maximum longevity (tmax) across vertebrates. A, Gray circles: all mammal, bird, reptile, and amphibian species in AnAge (n = 1456). B, Gray line: avian regression curve; black line: mammalian regression curve minus bats and cetaceans. Closed circles: primates (n = 137); gray squares: bats (n = 73), the two longest-lived mammalian orders for their body size.
