
Figure 2.
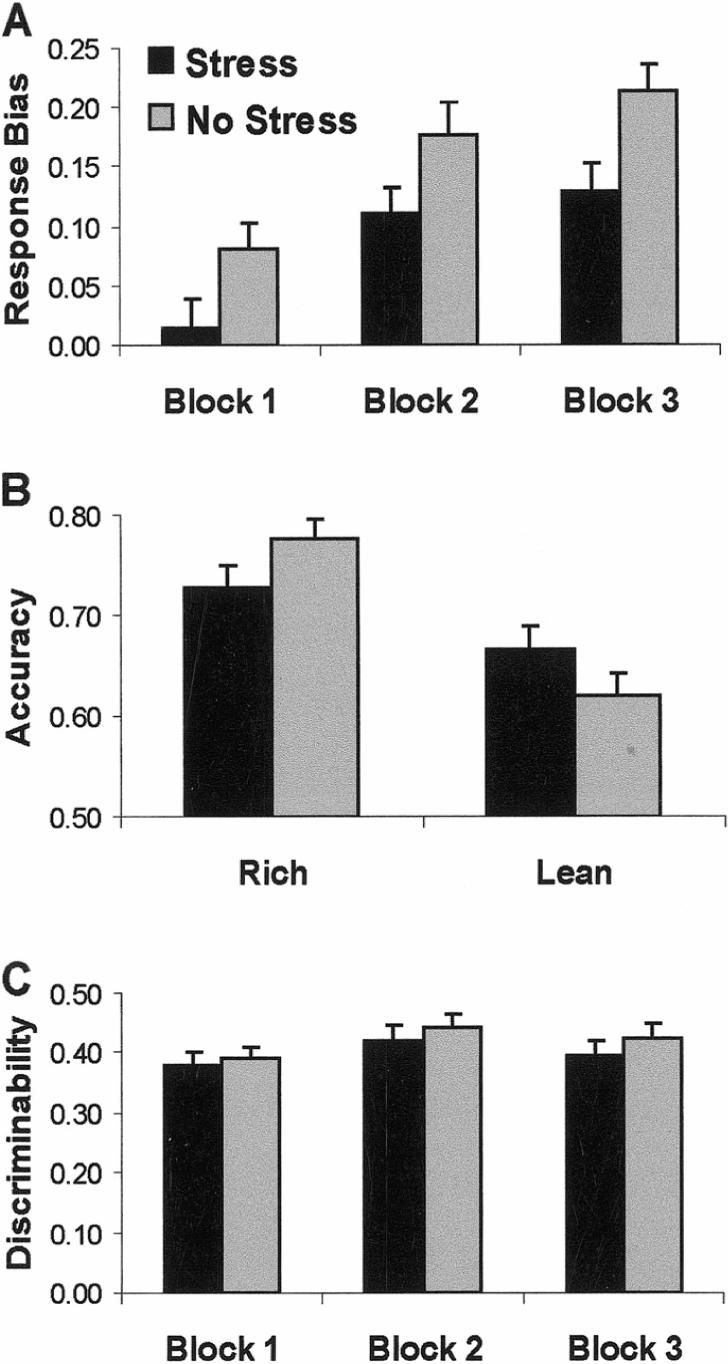
Overall effect of task manipulation on behavioral measures. (A) Response bias (entire sample; n_80); (B) accuracy (threat-of-shock manipulation; n _ 38); (C) discriminability (entire sample; n _ 80). Error bars represent standard errors. The black bars represent the stress condition while the light gray bars represent the no-stress condition.