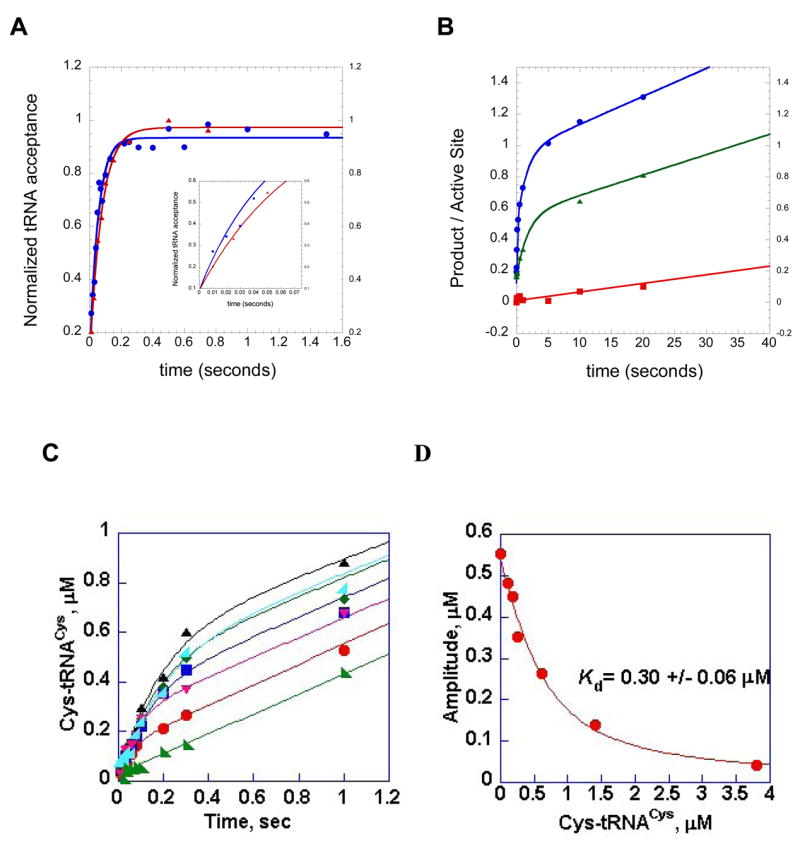
Figure 5.

Representative single turnover and multiple turnover rapid chemical quench kinetic experiments performed in the HisRS and CysRS systems. (A) single turnover aminoacylation kinetics of wild type HisRS:wild type tRNA cognate interaction (blue circles), and the interaction of wild type HisRS with G34U tRNAHis (red triangles). The inset provides a close-up of the first 100 milliseconds of both reactions, illustrating the faster rate of wild type relative to the tRNAHis variant. (B) pre-steady kinetics of HisRS AMP and His-tRNAHis formation, for the identity-compromised C73U tRNAHis variant. Filled blue circles, AMP formation by wild type HisRS in the absence of tRNA. The progress curve is fit to a double exponential followed by a linear phase. Green triangles, AMP formation by wild type HisRS in the presence of C73U tRNAHis. The plot is fit to a single exponential followed by a linear phase. Red squares, His-tRNAHis formation by the C73U tRNAHis variant tRNA. This curve is fit to a linear equation. The difference in slope between the linear portions of the plots for AMP formation and His-tRNAHis formation by the C73U tRNAHis variant represents the stoichiometry of ATP consumption relative to aminoacylated tRNA product formation. The data to derive plots A and B were reported in [66]. (C) time course of synthesis of Cys-tRNACys under single turnover (enzyme concentration in excess) conditions. The concentration of tRNACys was held fixed at 0.5 μM, while that for CysRS was varied between 1 and 20 μM. (D) Re-plot of amplitudes from plot C against the concentration of Cys-tRNACys by hyperbolic fit to derive the Kd for tRNACys. Plots C and D are adapted from Zhang et al.[63].
