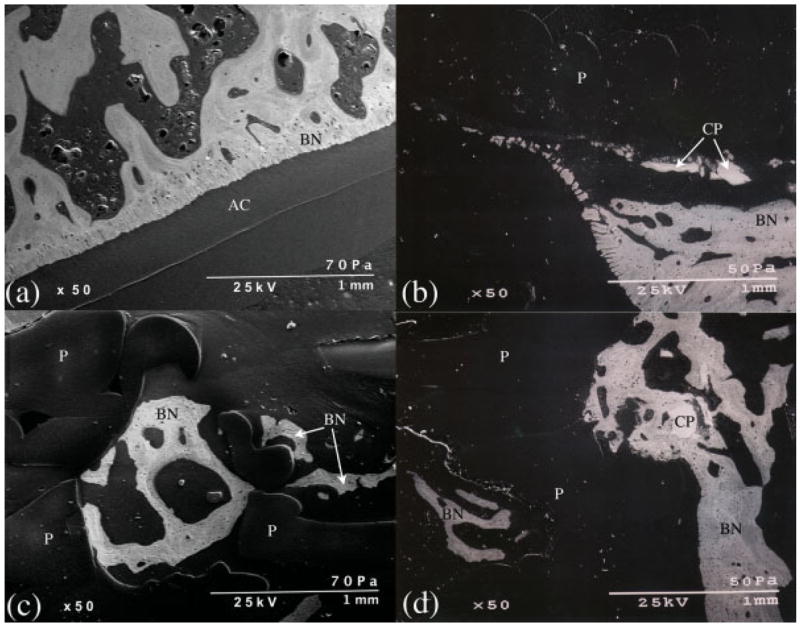
Figure 11.

Backscatter electron microscopy images of the superficial scaffold region of the control (a) and the experimental (b) joints. (c) is an image from within the scaffold region of an experimental stifle demonstrating bone (BN) within a PBT (P) pore. (d) shows bone surrounding a CPC particle (CP) and growing up to the scaffold edge as well as bone within a PBT pore. AC, articular cartilage. [Color figure can be viewed in the online issue, which is available at www.interscience.wiley.com.].
